Harnessing the Power of the Sun: A Year in Review
In this annual update I give an update on the 2023 performance of our photovoltaic system and comparing it with previous years’ data. This is a follow up to last years post series about the installation and first energy yield numbers (1, 2, 3).
2023 Solar Energy Production Overview
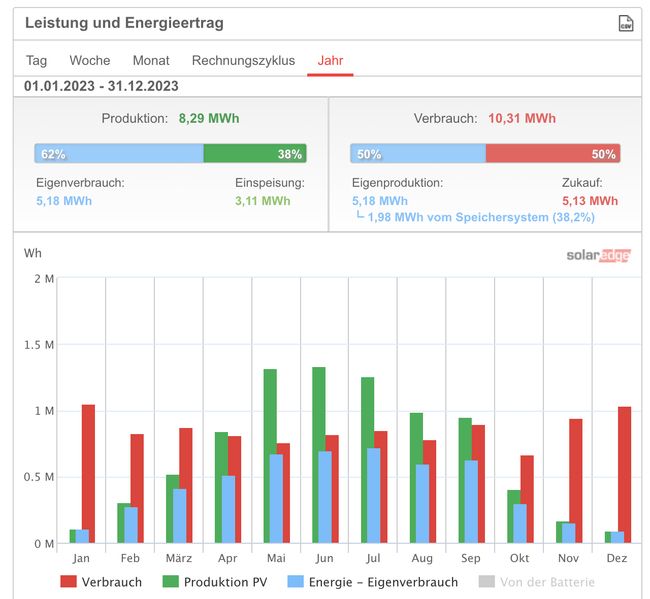
#- Total solar energy produced in 2023: 8.292 kWh
- Average monthly solar energy production: 691 kWh
- Month with highest production: May with 1.330 kWh
- Lowest monthly production: 93 kWh in December

5.180 kWh of the produced energy was consumed by ourselves which is a ration of 62%. The surplus of 3.112 kWh was fed back into the grid.
On the consumption side we used a total of 10.312 kWh of electricity. Most of this was for the heat pump (2.865 kWh), second highest consumer is our car which we charged with 2.095 kWh. 50% (5.180 kWh) of the consumed electricity produced by our selfs and the second 50% we got it from the power grid.
Comparing with Previous Years
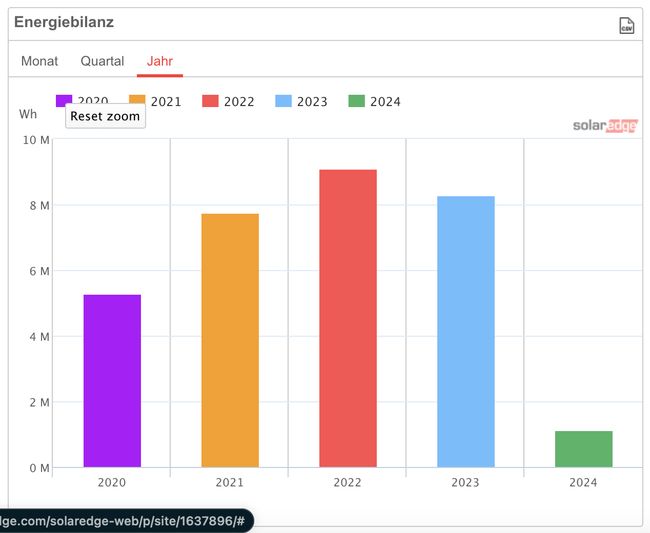
#- 2023 vs. 2022: Total energy production in 2023 was significantly lower than the year before. Overall solar energy production decreased 9% from 9.098 kWh to 8.292 kWh
While the summer months (May, June, July and August) were about the same, we produced significantly more electricity in spring 2022, than in the same period in 2023. March and April were very rainy months in our region and the sky was often very cloudy.
November 2023 we got already some snow very early, for the area we live. As a result, next to nothing was produced for two weeks.

Overall, 2023 was still the 2nd best year for our solar system.
By harnessing the power of the sun we have reduced our carbon footprint and already saved more then 12 tones of CO2 emissions. Especially in the summer month were are mostly energy independent and don’t consume many kWh from the power grid.
I’m curious to see what the numbers will look like at the end of the year for 2024. So far the first 3 months are looking very good. January was actually the best January so far.
Hero image taner ardalı from Unsplash
