Going Green: Our Own Electricity
In part 2 of my “Our Own Electricity” series I give an insight into our electricity production and consumption. After I explained our setup I will share details on the installation costs, our break even calculation.
Disclaimer: the numbers below are actual numbers from our installation. There will be differences in numbers based on the place where you live, the local regulations and the hours of sun you get.
Energy Production
#The initial estimates of electricity yield from the sales offers were all around 9 MWh per year. Of course, I knew that they were all overestimated, people wanted to sell us a photovoltaic system.
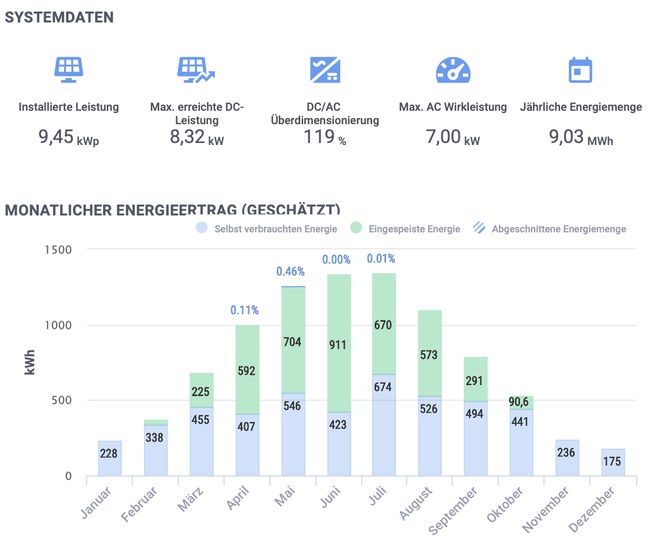
I now have real data from 2.5 years. First overall I am very satisfied with the energy production of our installation.
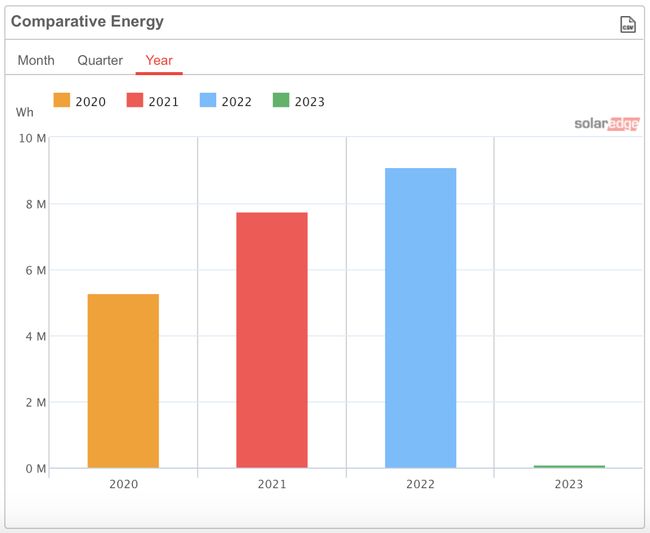
In 2021, the first full year, our photovoltaic system produced 7,78 MWh. I’m very happy especially with the electricity production in 2022. Last year we had very sunny spring and summer and could produce 9,1 MWh. This is even a tiny bit higher than the initial estimates.
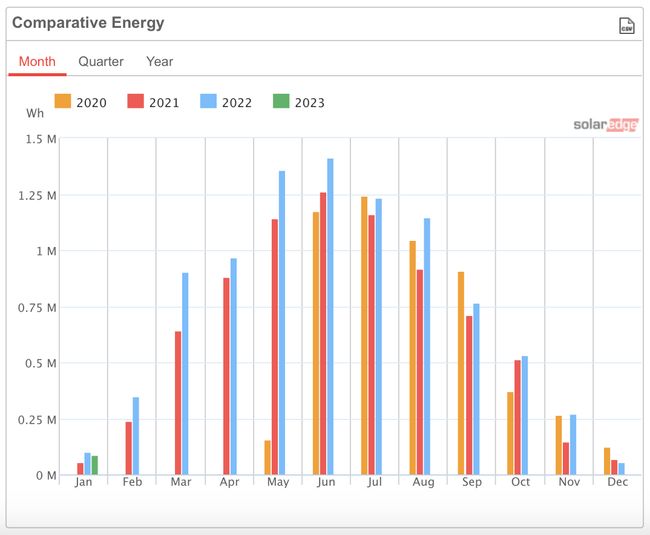
In 2022 the electricity yield was higher than in 2021 in all months except December. See light blue bars in the diagram above. Only 60 kWh were produced throughout December 2022. We can produce almost the same on a summer day in July or August. We produce approximately 90% of the electricity between March and October. Darker winter months - November till February are usually very low in electricity yield. Living in central Europe 51° N there is not much sun during these month. And when the sun shines, it only shines for a few hours and at a flat angle.
Last years we didn’t had much snow at the place we live. But if we had some it usually stayed for a while. During that time no electricity is produced even on sunny days if the panels are covered with snow. In December 2022 we had exactly such a case. It snowed for two days and then one week of super sunny winter days but the snow didn’t melt.
Overall we get 50% of the electricity yield in 1/3 of the time. During the summer months May till August we produce > 1MWh each month. April 2022 was also close to 1MWh. The rest of the year the electricity yield is lower, especially during the winter months.
Effect of the battery storage
#In retrospect it was a good decision to install a battery. I was initially skeptical as to whether it would be worth it, especially because of the extra acquisition and installation costs calculation below.
In 2022 we consumed 38% (2.145 kWh) of our self produced electricity from the battery. Like any battery, a solar battery storage also has a low energy loss. The manufacturer claims it has over 90% efficiency. So we loaded ~ 2.383 kWh into the battery to get 2.145 kWh out. Without battery this would be send to the grid during the day and consumed from the grid during the evening our. This saved us over 400 Euro, see calculation below.
A typical battery charging and dis-charging curve on a summer day looks like this:

Making the maths
#Ok how profitable is the whole thing now really. The numbers below are from the initial calculation I made during our planing phase end of 2019. With the current energy crisis 2022 here in Europe and especially in Germany, the savings for every kilowatt hour that we produce ourselves are even higher. While paying lot more for electricity consumed from the grid we also save more money for every kilowatt we produce ourselves and don’t consume from the public grid.
Acquisition costs
#When reading this part please keep in mind that we installed the solar panels early 2020, more than two years ago. Prices cannot be compared one-to-one with today’s price ranges for photovoltaic hardware, batteries and installation service costs. The cost of photovoltaic hardware, batteries and installation services have increased significantly since the installation of our system two years ago.
Our installation costs are made up as follows:
| Item | Amount |
|---|---|
| Photovoltaic system | 11.407,46 € |
| BYD battery storage | 5.765,07 € |
| Electric assembly DC & AC | 3.811,00 € |
| Delivery | 328,00 € |
| Total (pre tax) | 21.311,53 € |
| VAT 19% | 4.049,19 € |
| Total (incl. tax) | 25.360,72 € |
| Battery storage funding | -3.200 € |
| Final installation cost | 22.160,72 € |
The first row of the table includes the 27 Qcells solar panels, the SolarEdge inverter, 27 SolarEdge optimizers, substructure, cables, and assembly on the roof. The electric assembly package contains the DC cable installation, connecting everything to the inverter, connecting the converter with the AC election installation in our house, installing overvoltage protection, all the cabels and configuring the SolarEdge inverter with the right parameters.
As part of the Sächsische Aufbaubank funding program, we received 3.200 € for the installation of a photovoltaic battery system. Most likely, we wouldn’t have installed a battery storage system without the funding. By the end of 2019, electricity costs would not have made the purchase worthwhile. Luckily we did. However since electricity costs a lot in 2019, the calculation would be different now and today I would recommend to install a photovoltaic battery for most set ups.
Impact of the battery storage
#As written above in 2022 we consumed 2.145 kWh out of the photovoltaic battery. The photovoltaic battery, like every other battery, has some loss of charge. The energy amount loaded into the storage system was ~ 2.383 kWh.
Would these 2.383 kWh have been sent back into the grid we would get some compensation for it.
2.383 kWh * 0,0967 € = 230 € of theoretical compensationThe same time we would have drawn the 2.145 kWh from the grid instead from the battery. The price for that, with rates of 2022, would be:
2.145 kWh * 0,2996 € = 643 € of theoretical electricity costThe battery saved us approximately 413€ in one year. Giving the installation cost of the battery system (3200€) the investment is recovered after 8 years.
Savings & break even
#Our self-produced electricity saves us a few hundred euros on our electricity bill. Based on the final installation costs of 22.160,72 € for the entire system, we calculated that the break even point would be after 18 years. How is it today?
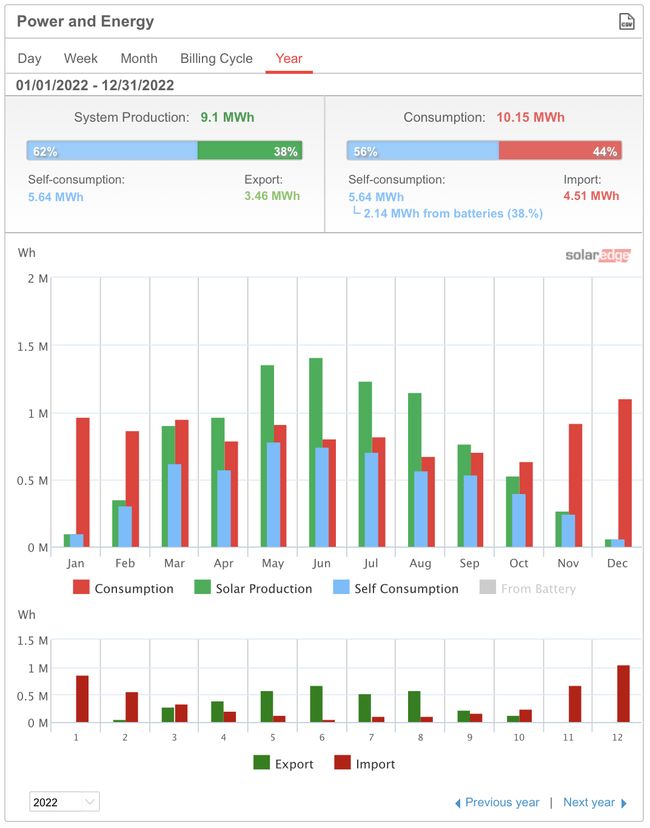
We reached 62% self-consumption on the production side in 2022. 3.460 kWh (= 38%) have been feed into the grid. For each kWh we don’t use ourselves and feed into the grid we receive 0,0967 € feed-in tariff. This amount is guaranteed for 20 years by the
Erneuerbare-Energien-Gesetz (EEG = Renewable Energy Sources Act in Germany).
For 2022 this means:
3.460 kWh* 0,0967 € = 334,97 €On the consumption side we ended up with 56% self-consumption out of 10.150 kWh consumed energy. This means 5.640 kWh we did not consume from the grid.
5.640 kWh *  0,2996 € = 1689,74 €

with 0,2996 € = our price per kWh in 2022
In the end, we gained the equivalent of 1.689,74 € of free electricity. A lot of money was saved on the electricity bill. Due to the difference between the consumption tariff and the feed-in tariff, optimizing for self-consumption makes the most sense. We save more money on every kWh of self-produced electricity than we receive for grid excess energy.
In total, savings on self-consumption plus money from electricity feed-in, we “earned” 2.024 €. Based on that projection, the break even point should be reached within 12 years. With the updated, increased consumption rates we already got for 2023 of 0,52 € per kWh this we should hit it even earlier.
My original plan was to write an extra section about taxes as well. But I would only be able to explain the rules for Germany and even here I’m not a tax expert. Other countries have different laws and tax rules and even here in Germany things are constantly changing. So I will skip that part as it would likely be outdated at the time of writing.
Grand total
#So far we are pretty happy with our installation. By installing a photovoltaic system, we have been able to save money on our electricity bills, as well as earn some money from the sale of our excess electricity. We earned a value of 2.024 € in 2022 (1.631€ in 2021). Installing the photovoltaic system was definitely the right choice if this continues in the coming years.
We save money on and do something good for the environment at the same time.
In the next post I will explain how I integrated our photovoltaic system with Home Assistant to get more detailed data and electricity monitoring for our entire house.
Hero image photo by Daniel van den Berg on Unsplash
